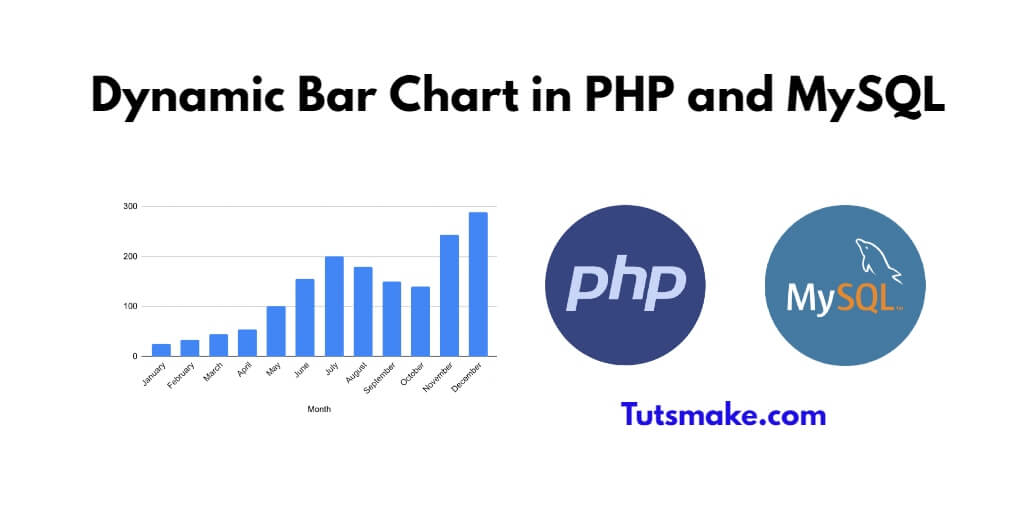
In this tutorial, we would love to show you how to create dynamic bar charts in PHP and MySQL database using Chart JS library.
How to Create Dynamic Bar Chart in PHP and MySQL
Here are steps to create a dynamic bar chart using PHP and MySQL:
- Step 1: Create Database Table
- Step 2: Set up Database
- Step 3: Fetching Data from the Database
- Step 4: Create the Bar Chart in Html
- Step 5: Testing the Chart
Step 1: Create Database Table
Create a table in MySQL database, run the following SQL query to create a table named chart_data:
CREATE TABLE chart_data (
  id INT(11) PRIMARY KEY AUTO_INCREMENT,
  label VARCHAR(255) NOT NULL,
  value INT(11) NOT NULL
);
Step 2: Set up Database
Create a chart.php file that manages to connect to the MySQL database with the PHP project:
<?php
$servername = "localhost";
$username = "your_username";
$password = "your_password";
$dbname = "your_database";

$conn = new mysqli($servername, $username, $password, $dbname);

if ($conn->connect_error) {
  die("Connection failed: " . $conn->connect_error);
}
?>
Step 3: Fetching Data from the Database
Create chart.js file and implement php code in it to fetch or retrieve the data from the chart_data table:
<?php
// Fetch data from the database
$sql = "SELECT label, value FROM chart_data";
$result = $conn->query($sql);

$data = array();
while ($row = $result->fetch_assoc()) {
  $data[] = $row;
}

// Close the database connection
$conn->close();
?>
Step 4: Create the Bar Chart in Html
Create an HTML file named index.html and add the following code to create bar chart using charts.js library:
<!DOCTYPE html>
<html>
<head>
  <title>Dynamic Bar Chart for Web Application Data</title>
  <script src="js/Chart.min.js"></script>
</head>
<body>
  <canvas id="barChart"></canvas>

  <script>
    // Retrieve data from PHP
    var data = <?php echo json_encode($data); ?>;

    // Extract labels and values from the data
    var labels = data.map(function(item) {
      return item.label;
    });

    var values = data.map(function(item) {
      return item.value;
    });

    // Create a new bar chart
    var ctx = document.getElementById("barChart").getContext("2d");
    var chart = new Chart(ctx, {
      type: "bar",
      data: {
        labels: labels,
        datasets: [{
          label: "Data",
          data: values,
          backgroundColor: "rgba(75, 192, 192, 0.2)",
          borderColor: "rgba(75, 192, 192, 1)",
          borderWidth: 1
        }]
      },
      options: {
        responsive: true,
        scales: {
          y: {
            beginAtZero: true
          }
        }
      }
    });
  </script>
</body>
</html>
Note that:- Please visit Chart.js library from the official website (https://www.chartjs.org) and include it in your project by placing it in a directory named js within your project folder.
Step 5: Testing the Chart
Now open the index.html file in a web browser to visualize your web application data in the dynamic bar chart.
Conclusion
This tutorial taught you how to create a dynamic bar chart using PHP, MySQL, and Chart.js.
