React js Google column chat example; Through this tutorial, you will learn how to integrate or add a google column chart in react js application.
React Google Charts offers a declarative API to make rendering charts fun and easy.
How to Create and Use Google Column Charts in React Js
Follow the following steps to implement and use google column chart in react js app:
- Step 1 – Create React App
- Step 2 – Install Bootstrap & react-google-charts Package
- Step 3 – Create Google Column Charts Component
- Step 4 – Add Component in App.js
Step 1 – Create React App
In this step, open your terminal and execute the following command on your terminal to create a new react app:
npx create-react-app my-react-app
To run the React app, execute the following command on your terminal:
npm start
Check out your React app on this URL: localhost:3000
Step 2 – Install Bootstrap & react-google-charts Package
Execute the following command to install the Google Charts library and its React wrapper. You can do this by running the following command in our terminal:
npm install bootstrap

# npm
npm install react-google-charts

# yarn
yarn add react-google-charts
The code npm install bootstrap is a command used to install the Bootstrap framework as a dependency for a project that is managed with the Node Package Manager (npm).
Bootstrap is a popular front-end development framework that provides pre-designed CSS and JavaScript components for building responsive, mobile-first websites and web applications.
By running this command, npm will download and install the latest version of Bootstrap from the npm registry and add it as a dependency to the project’s package.json file. This will allow the project to use the Bootstrap framework in its codebase.
Similarly, the code npm install react-google-charts or yarn add react-google-charts is used to install the react-google-charts package, which is a React wrapper for the Google Charts library that allows developers to easily integrate charts and graphs into their React applications.
This command will download and install the latest version of the react-google-charts package from the npm registry and add it as a dependency to the project’s package.json file, allowing the project to import and use the react-google-charts components in its codebase.
Step 3 – Create Google Column Charts Component
Visit the src directory of your react js app and create google column chart component named GoogleChart.js. And add the following code into it:
import React, { Component } from "react";
import Chart from "react-google-charts";
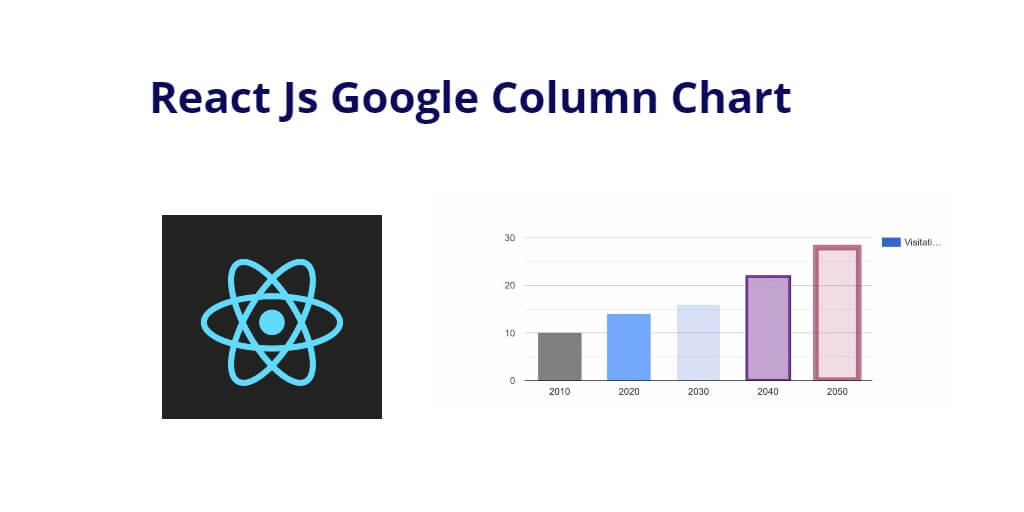
const data = [
['Year', 'Visitations', { role: 'style' } ],
['2010', 10, 'color: gray'],
['2020', 14, 'color: #76A7FA'],
['2030', 16, 'opacity: 0.2'],
['2040', 22, 'stroke-color: #703593; stroke-width: 4; fill-color: #C5A5CF'],
['2050', 28, 'stroke-color: #871B47; stroke-opacity: 0.6; stroke-width: 8; fill-color: #BC5679; fill-opacity: 0.2']
];
class GoogleChart extends Component {
constructor(props) {
super(props)
}
render() {
return (
<div className="container mt-5">
<h2>Google Column Chart in React Js</h2>
<Chart
width={700}
height={320}
data={data}
chartType="ColumnChart"
loader={<div>Loading Chart...</div>}
/>
</div>
)
}
}
export default GoogleChart;
The above given code is a React component that renders a Google Column Chart. Here is a breakdown of the code:
- The first two lines import the necessary modules. React is the main library for building user interfaces in React, and Component is a class that all React components should extend. Chart is a third-party library that provides a React component for rendering Google Charts.
- The
dataconstant defines the data that will be plotted on the chart. The data is an array of arrays, where each inner array represents a row in the chart. The first element of each inner array is the x-axis label, the second element is the data point, and the third element is an object that specifies the style of the data point. - The
GoogleChartclass is a React component that extends theComponentclass. It has a constructor that calls the super constructor and initializes the state of the component. - The
rendermethod of theGoogleChartcomponent returns the JSX that will be rendered on the screen. The JSX defines a container div and aChartcomponent. TheChartcomponent takes several props that configure the chart, such as the width and height of the chart, the data to be plotted, the type of chart to be rendered, and a loader to be displayed while the chart is being loaded. - Finally, the
GoogleChartcomponent is exported so that it can be used in other parts of the application. Other components can import theGoogleChartcomponent and include it in their own JSX to render the chart on the screen.
Step 4 – Add Component in App.js
In this step, you need to add GoogleChart.js file in src/App.js file:
import React from 'react';

import '../node_modules/bootstrap/dist/css/bootstrap.min.css';
import GoogleChart from './components/GoogleChart';


function App() {
  return (
    <div className="App">
      <GoogleChart />
    </div>
  );
}

export default App;
Conclusion
React js column chart tutorial, you have learned how to install react google chats in react app and how to create google column charts component in react js app.